 FAO Map Catalog
Food and Agriculture Organization of the United Nations
Type of resources
Available actions
Topics
Keywords
Contact for the resource
Provided by
Years
Formats
Representation types
Update frequencies
status
Scale
Resolution
-

The World Port Index (Pub 150) contains the location and physical characteristics of, and the facilities and services offered by major ports and terminals world-wide (approximately 4300 entries). Entries are organized geographically in a tabular format, in accordance with the diagrams located in the front of the publication. The World Port Index publication can be freely downloaded in its entirety as an Adobe PDF document, a Microsoft Access database, or as an ESRI Shape file at the NGA (National Geospatial Intelligence Agency, USA) portal: http://www.nga.mil/NGAPortal/MSI.portal?_nfpb=true&_pageLabel=msi_portal_page_62&pubCode=0015
-
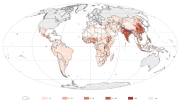
Chronic child malnutrition (stunting among children under 5 years of age) represents a good proxy of rural poverty and food insecurity (FAO 2008 and FAO 2003) and, by overlaying stunting rate and population density, this map aims at showing poor population distribution (person/sq km) in developing countries.
-

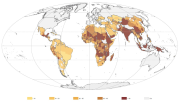
Accessibility to major cities dataset is modelled as raster-based travel time/cost analysis, computed for the largest cities (>50k habitants) in the country. This 1km resolution raster dataset is part of FAO’s Hand-in-Hand Initiative, Geographical Information Systems - Multicriteria Decision Analysis (GIS-MCDA) aimed at the identification of value chain infrastructure sites (or optimal location).
-
This map is adapted from a global GIS database maintained by FAO on food insecurity, poverty and environment global GIS database (FGGD). It is based on stunting data among children under 5 years of age, around year 2000. Stunting among children is used by FAO as an indicator of food insecurity and, indirectly, of poverty.
-

Aqua MODIS Climatology Sea Surface Temperature (Spring 2002-2009) Level-3 Standard Mapped Image product in degrees Celsius. The MODIS Aqua Global Level 3 Mapped SST product consists of sea surface temperature (SST) obtained by the Moderate Resolution Imaging Spectroradiometer (MODIS), in orbit on the Aqua (formely EOS PM) platform. Data are currently available globally at 4 km, and 9 km resolutions with daily, weekly (8 day), monthly and annual time intervals in HDF files. These data are the latest science quality Level 3 files processed and distributed by the Ocean Biology Processing Group (OBPG) located at the NASA Goddard Space Flight Center. These data were downloaded from NASA Ocean Colour Web (http://oceancolor.gsfc.nasa.gov/cgi/l3) using Marine Geospatial Ecology Tools (MGET).
-

The map summarizes the status of the land use and land cover at global scale. It was compiled according to the current GAEZ (Global Agro-Ecological Zones) -2009 approach, developed by FAO in collaboration with IIASA (International Institute for Applied Systems Analysis).The current Global AEZ (GAEZ-2009) offers a standardized framework for the characterization of climate, soil and terrain conditions relevant to agricultural production, which can be applied at global to sub-national levels. The map is based on six geographic datasets: - GLC2000 land cover database at 30 arc-sec (http://www-gvm.jrc.it/glc2000), using regional and global legends (JRC, 2006); - an IFPRI global land cover categorization providing 17 land cover classes at 30 arc-sec. (IFPRI, 2002), based on a reinterpretation of the Global Land Cover Characteristics Database (GLCC ver. 2.0), EROS Data Centre (EDC, 2000); - FAO’s Global Forest Resources Assessment 2000 and 2005 (FAO, 2001; FAO, 2006) at 30 arc-sec. resolution; - digital Global Map of Irrigated Areas (GMIA) version 4.0 of (FAO/University of Frankfurt) at 5’ by 5’ latitude/longitude resolution, providing by grid-cell the percentage land area equipped with irrigation infrastructure (Siebert et al., 2007); - a spatial population density inventory (30-arc seconds) for year 2000 developed by FAO-SDRN, based on spatial data of LANDSCAN 2003, with calibration to UN 2000 population figures. An iterative calculation procedure has been implemented to estimate land cover class weights, consistent with aggregate FAO land statistics and spatial land cover patterns obtained from remotely sensed data, allowing the quantification of major land use/land cover shares in individual 5’ by 5’ latitude/longitude grid cells.
-
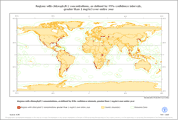
This dataset identifies all regions in which the full 95% confidence interval is greater than 1 mg/m3 for all 12 months. The chlorophyll 2 data includes the mean chlorophyll 2 level per month, the standard deviation and the number of observations used to calculate the mean. Based on these values, the 95% upper and lower confidence levels about the mean for each month have been generated.
-
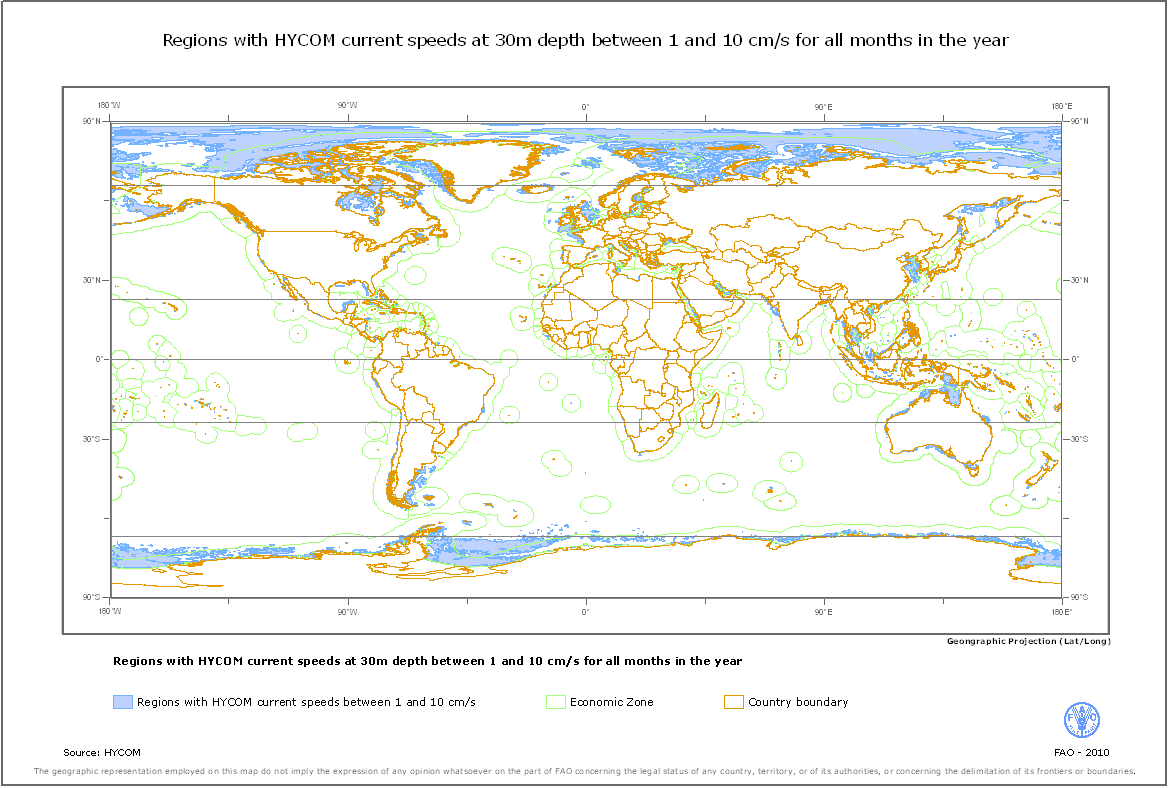
The HYCOM current speed data includes the mean current speed per month, the standard deviation and the number of observations used to calculate the mean. Based on these values, 95% upper and lower confidence levels about the mean for each month have been generated. All regions in which the full 95% confidence interval was wholly between 1 and 10 cm/s for all 12 months have been then identified.
-
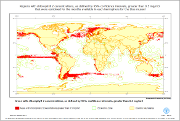
This dataset identifies all regions in which the full 95% confidence interval is greater than 0.5 mg/m3 that were combined for the months available in each hemisphere for the blue mussel. The chlorophyll 2 data includes the mean chlorophyll 2 level per month, the standard deviation and the number of observations used to calculate the mean. Based on these values, the 95% upper and lower confidence levels about the mean for each month have been generated.
-
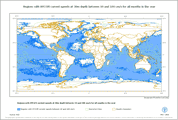
This dataset identifies all regions in which the full 95% confidence interval is wholly between 10 and 100 cm/s for all 12 months. The HYCOM current speed data included the mean current speed per month, the standard deviation and the number of observations used to calculate the mean. Based on these values, the 95% upper and lower confidence levels about the mean for each month have been generated.